5 Metrics Fundraisers Need to Know to Retain Their Donors

Donor retention is undeniably critical to meet your nonprofit’s revenue goals, but it can be tough to know which efforts result in higher retention levels or upward movement of donors.
That’s why we put together a list of the five essential metrics you need to know, as a fundraiser, to achieve higher retention rates. Tracking these metrics will help you keep a pulse on the current engagement of your donors so you know which efforts are working and which ones need to be increased or modified.
The 5 retention metrics fundraisers should know are:
- Donor Attrition Rate
- Donor Level Moves
- New vs. Recurring Donors
- Frequency of Engagement
- Portfolio Status
-
Donor Attrition Rate
What it is:
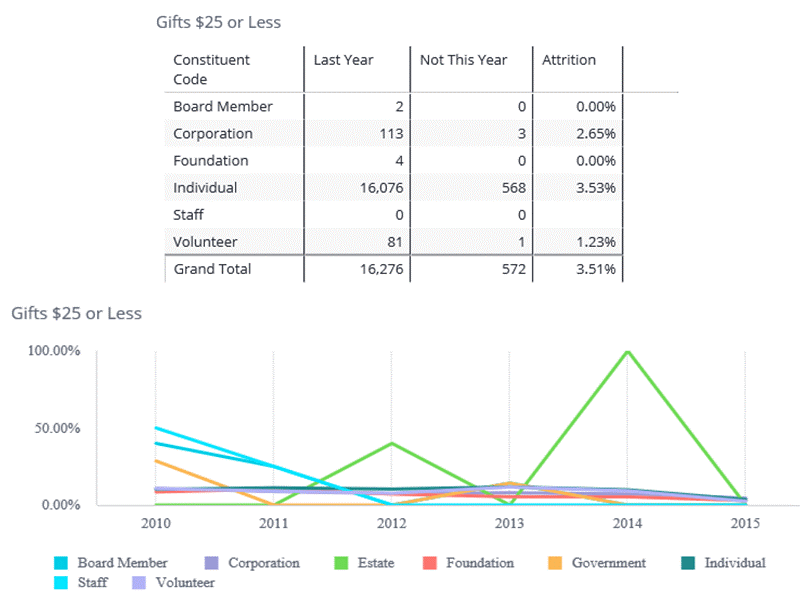
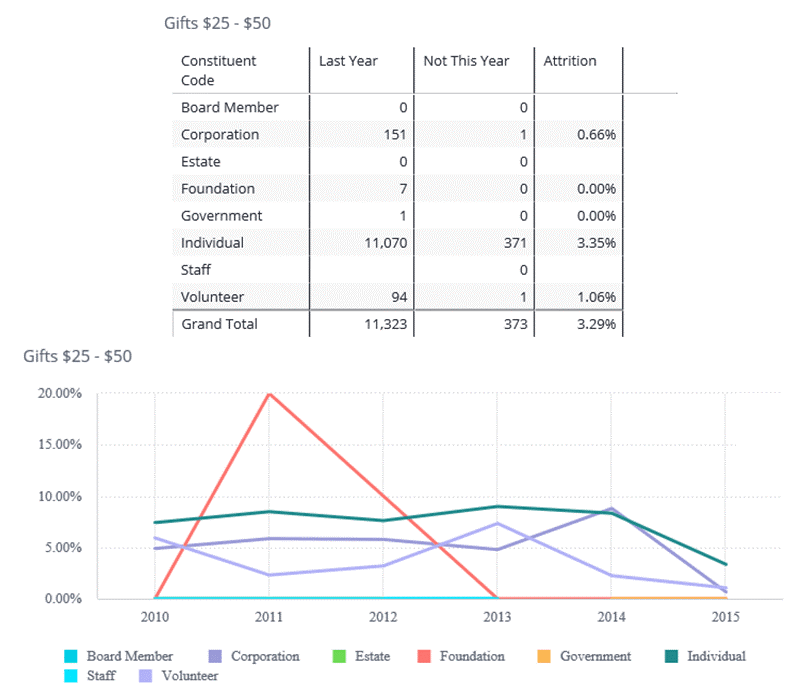
The percentage of donors who did not return within a particular giving level or donor category.
Why it’s important:
Different levels of giving levels and donor categories receive different appeals and benefits. By tracking attrition rate by level, you can see which levels and which efforts have been most successful. A high attrition rate at a certain level may signal that this level is perceived as not being valuable enough for the amount the donor is giving. While a low attrition rate helps signal that the fundraising efforts for that level have been successful.
Plus, decreasing attrition rates save your organization time and money. If there’s a category with a high attrition rate, it’s going to be more costly for your team to continue to fill that donor bucket than to keep those who are already in that bucket satisfied. As reports show, keeping existing donors engaged results in a higher ROI than acquiring new donors.
How to track it:
[Count of Constituents Who Had a Gift Last Year AND Don’t Have a Gift This Year]
__________________________________________________________________________
[Count of Constituents Who Had a Gift Last Year]
-
Donor Level Moves
What it is:
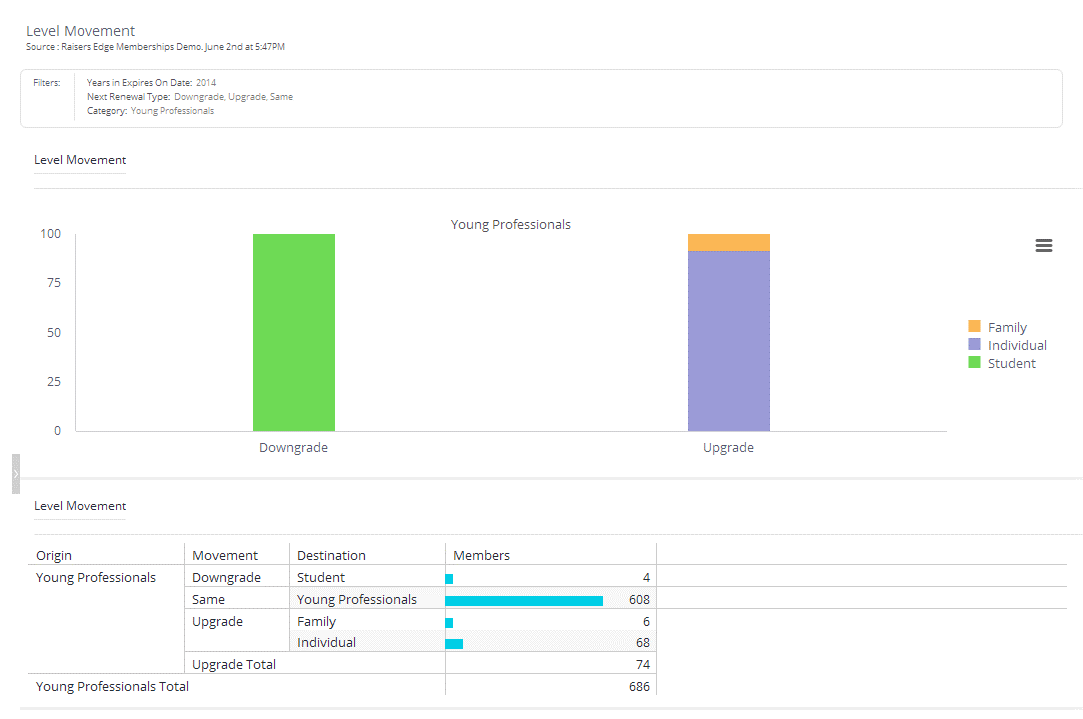
This metric tracks how many donors have moved up or down and how long donors have stayed at the same level. This can be based on membership, category, and/or constituency code.
Why it’s important:
By tracking donor level moves, you’ll be able to see the trends of movement between gift amounts and giving levels amongst donors. This allows you to assess the efficacy of your efforts as well as determine candidates for major gifts.
When you see an upward movement trend of your constituents, then you can confirm that the efforts were effective. If you see downward movement—particularly sudden movements—you’ll need to assess why the downward trend is happening.
Membership organizations can use reports on donor level moves to see if there are people consistently moving up in membership levels who may be good major gift prospects. On the flip side, a large drop-off in donor level moves may signal a gap in membership levels. Oftentimes, people age out of their membership levels and don’t have another level to move into. For instance, there may be no membership options in-between student and family, or from family to senior citizen.
For non-membership organizations, you will look at changes in gift amount to track donor level moves. Tracking each donor level move will reveal which donors are ready to be cultivated and moved into a Major Giving Portfolio. Simply looking at which donors have given a large gift doesn’t tell the entire story because a donor who donates a large one-time gift is far different than a donor who gives increasingly larger gifts each year. The donors who have consistently increased their gift size are the ones that you’ll want to move into a Major Giving Portfolio—and tracking donor moves will show you which donors have been regularly increasing their gift size.
How to track it:
First off, you will need to rank your levels, since this is likely not done in your system by default. Once you have defined the levels, develop a method to track which level each constituent is in year after year. For membership organizations, this can be done by looking at membership categories and for non-membership organizations, this can be done by looking at yearly giving levels.
To keep track of these trends, choose the right charts and visualizations for your dashboard and then regularly report on upward and downward trends within each level.
-
New Donors vs. Recurring Donors
What it is:
This metric reveals how many of your existing donors gave for the first time in the current year compared with how many donated prior to the current year.
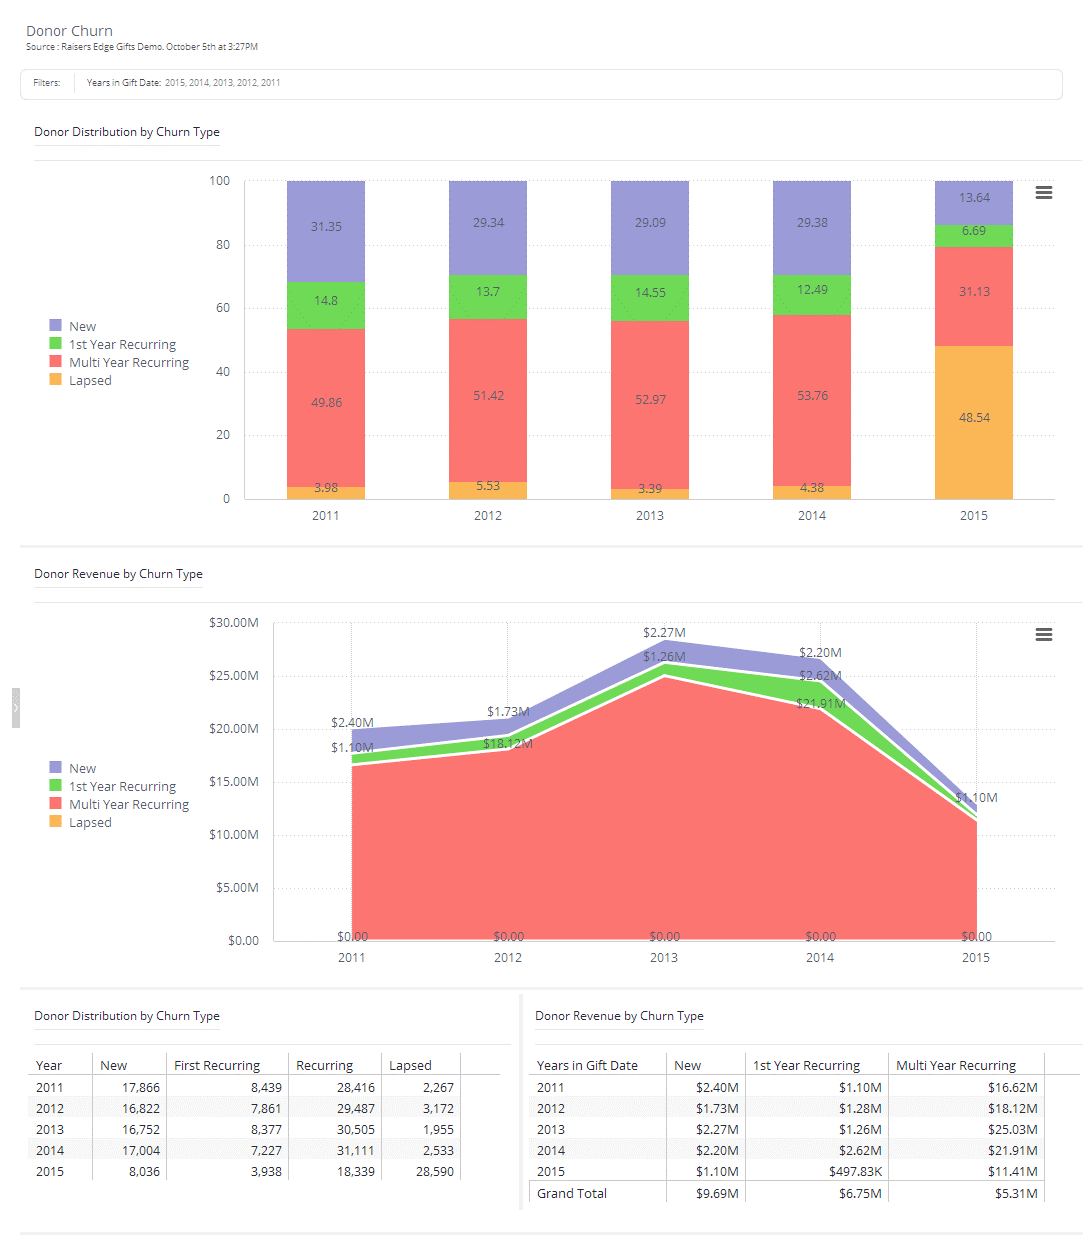
We suggest breaking down new and recurring donors into four categories representing the most common groups to calculate:
- New donor
- First year recurring donor
- Multi-year recurring donor
- Lapsed donor
Separating donors into these four levels will give you a more accurate idea of how much effort will be required to engage each donor to give in the current year.
Why it’s important:
This categorization of donors will also help you drive more effective appeal efforts. You will be able to have different messaging and strategies for donors depending on their frequency of giving and familiarity with your organization.
For example, your appeal to lapsed donors will encourage them back into the giving process. Since they are already familiar with who you are, you won’t need an in-depth background on your organization. Instead, you’ll focus on how your organization has changed since the donor last engaged with you.
Knowing the categories of your donors will also determine the level of effort you’ll need to engage them again. Your appeals to new donors will require much stronger efforts than the appeals for recurring donors.
How to track it:
You can track this metric by defining the different categories of donors in your system. Then use your system to calculate how many of your organization’s donors fall into each category.
-
Frequency of Engagement
What it is:
Frequency of engagement measures how many points of contact per donor your organization makes. This can include emails, letters, phone calls, events, and meetings, and any other types of contact you determine as “engagement”.
Why it’s important:
By tracking frequency of engagement, your organization will have a good pulse on the strength of your donor engagement. Low engagement should be a red flag for that donor’s designated point person within your organization and high engagement is a sign of a healthy donor relationship.
Consistently tracking this information on various engagements will also allow your organization to see which types of efforts tend to lead to more or less successful appeals.
If a donor just gave a large gift, you can look at their profile and see what types of actions led up to that donation.
Or, if a consistent donor suddenly stopped giving, you can also see which actions may have led to disengagement. It may be a case of not communicating enough with that donor, or perhaps sending too many communications requesting donations (which could be interpreted as not valuing the funds that donor already gave).
How to track it:
The first step is defining which points of engagement are important to track for your organization. Then set up a system to report on this engagement information.
For example, at your organization, tracking frequency of engagement could involve combining data from your fundraising system, ticketing systems, and volunteer systems. If you are fully using the events module on a major donor level in Raiser’s Edge NXT, for example, this will involve identifying actions such as meetings, phone calls, and emails that are typically attached to proposals and appeals.
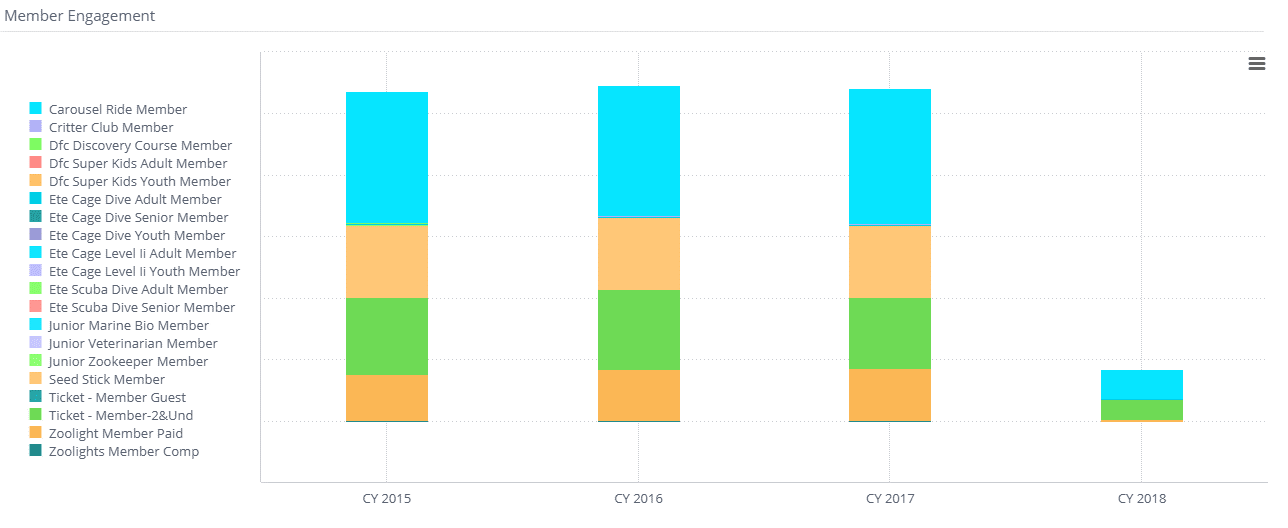
Frequency of engagement at a museum may look something like this:
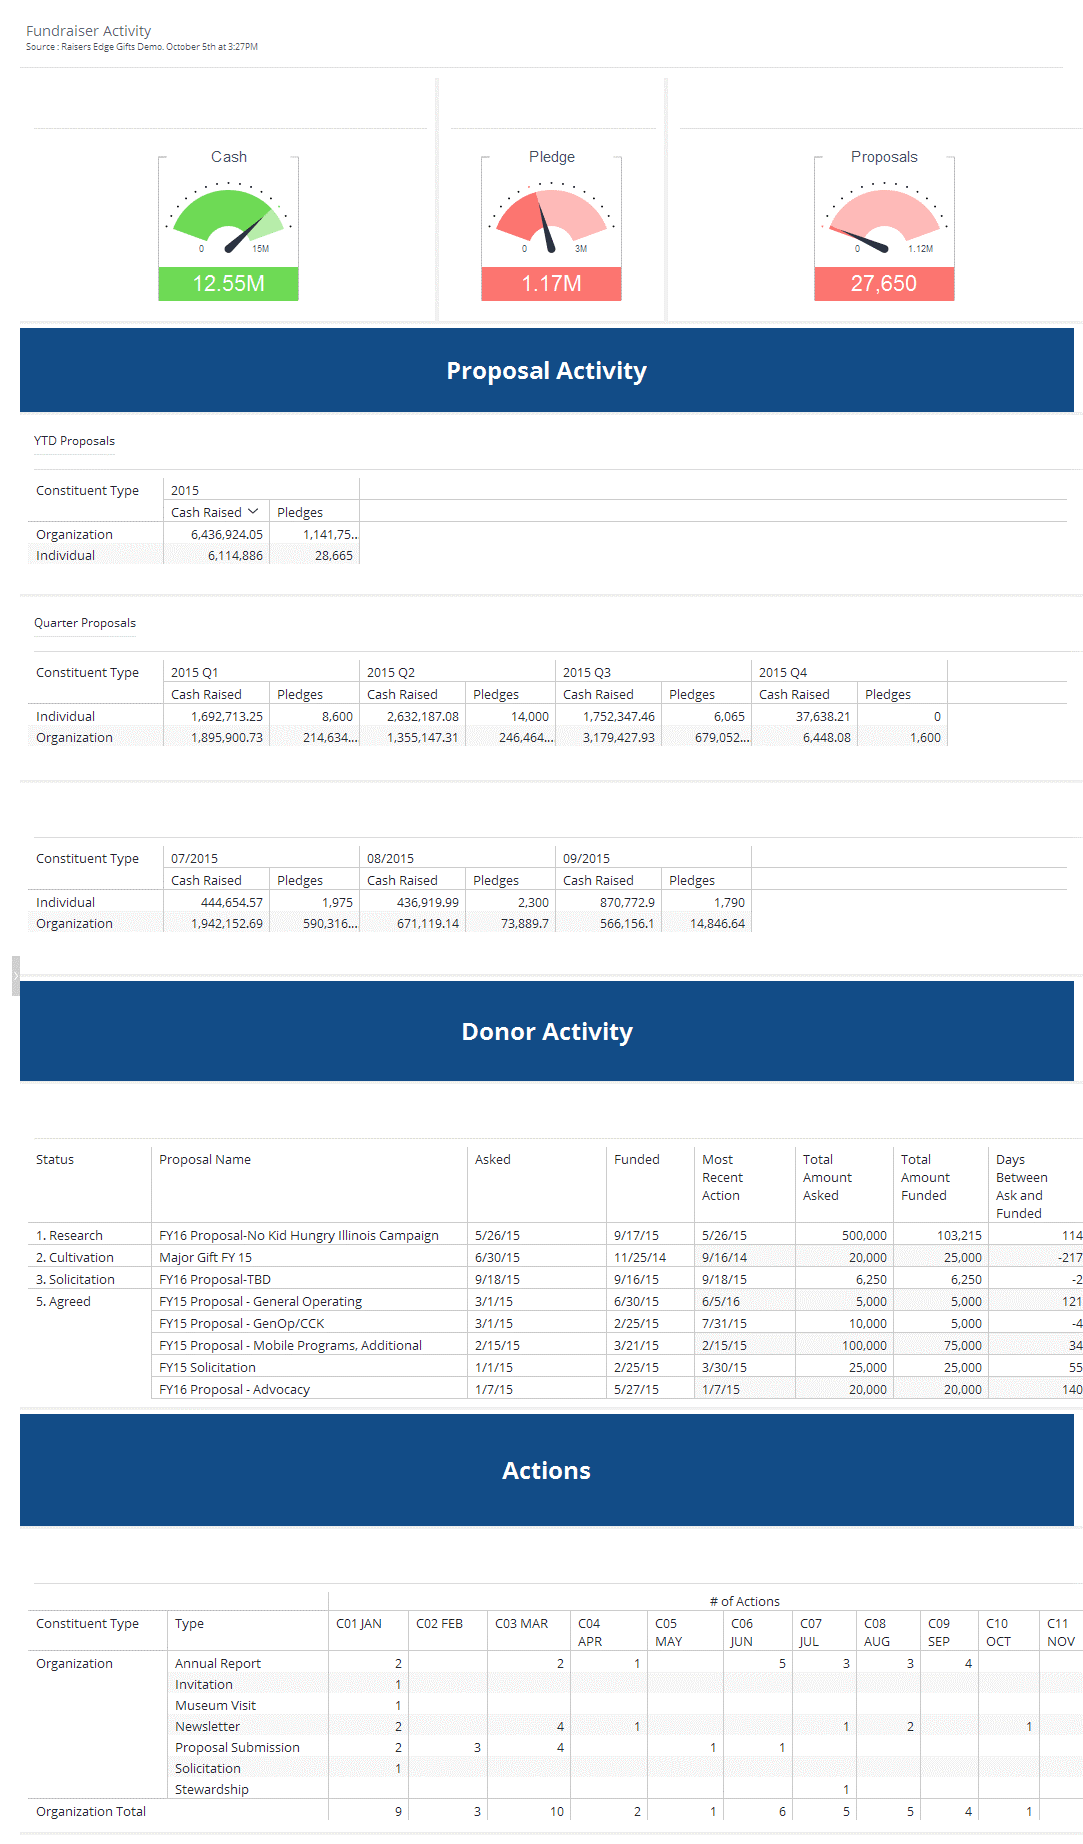
Frequency of engagement at a non-membership organization may look something like this:
-
Portfolio Status
What it is:
Portfolio status is a solicitor performance metric that tracks the various stages of donor cultivation. This metric is essential to track in order to know what stage donors are in, how long they’ve been in that stage, and any movement between the stages.
Why it’s important:
This metric helps keep cultivation efforts moving and will also serve as a signal if there’s an opportunity risk.
How to track it:
Logging the different stages of solicitation is typically done by tracking proposals or actions and tracking when they move or change stages along with the dates of those changes.
From that information you can calculate what their current status is, what their previous status was, how much time passed in between stages, and the average amount of time the donor was in a particular stage.
Knowing the average time a person stays in a stage can be crucial to identifying red flags. To illustrate this, let’s say that Donor A averages 50 days in a stage and Donor B averages four days in a stage. If Donor B all of the sudden gets stuck in one stage for 40 days then that should be identified as an opportunity risk since this is 10x as long as they typically remain in a stage. If Donor A, though, has been in a stage for 40 days, it shouldn’t trigger any warning signals since their average time in a stage has been 50 days.

Conclusion
These five metrics are crucial to track to ensure that your donor retention strategies are on track. Retaining a higher percentage of your donors will save your organization significant time, energy, and money spent on soliciting new donors. With these freed up resources, you’ll be able to further invest in your existing donors and increase retention even more.
