Blackbaud Index for April 2013
The Blackbaud Index
The Blackbaud Index provides the most up-to-date information on charitable giving today. Tracking approximately $11 billion in US-based charitable giving, the Index is updated on the first of each month and is based on year-over-year percent changes. Featuring overall and online giving, the Index can be viewed by size and subsets of the nonprofit industry.
Improvements to the Blackbaud Index
The Blackbaud Index has several new updates and improvements beginning this month. Here’s a brief overview of some of these updates:
Compare your fundraising performance: You can now easily compare and visualize your fundraising by entering in your fundraising revenue to the interactive chart. The more you add, the more complete of a trend line you’ll get! This tool can be invaluable when trying to determine if it was strategy, implementation, economies of scale, or donor behavior that drove results.
View historical data from The Blackbaud Index: Instead of just displaying the past 12 months, The Blackbaud Index will now display archived data going back to January 2010. This will allow users to look at Index trends over a more extensive period of
time to get a fuller picture of charitable giving in the United States.
Specialty indices focus on giving to healthcare, medical research organizations: In an effort to provide the most useful data for organizations in the healthcare field, The Blackbaud Index is splitting the Healthcare index, originally launched in 2011, into two specialty indices. The Healthcare index now tracks fundraising revenue for hospitals, nursing facilities, psychiatric facilities and other healthcare centers, while the Medical Research index tracks fundraising revenue for organizations that raise money to fund medical research, as well as medical education and advocacy.
Overall Fundraising Trends
The Blackbaud Index of Charitable Giving is a broad-based fundraising index that reports total revenue trends of 3,265 nonprofit organizations representing over $11.59 billion in yearly revenue on a monthly basis, both offline and online. The Index is based on actual revenue statistics from nonprofit organizations of all sizes representing arts, culture, and humanities; education; environment and animals; healthcare; human services; international affairs; medical research institutions, public and society benefit; and religion sectors.
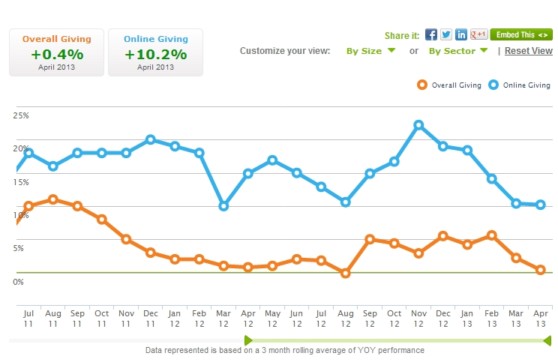
The Blackbaud Index of Charitable Giving reports that overall revenue increased by 0.4% for the 3 months ending April 2013 as compared to the same period in 2012. This is the first negative trend in 6 months. A 2% decline by large nonprofits and a slight decline by medium-sized nonprofit contributed to the overall negative trend.
Public and Society Benefit organizations were down 8.6% on a YOY basis and that is the third straight month of decline by this sector. Many other sectors include Healthcare, Human Services, and International Afairs are also trending negative.
Online Fundraising Trends
The Blackbaud Index of Online Giving is a broad-based fundraising index that reports online revenue trends of more than 2,753 nonprofit organizations representing over $1.59 billion in yearly revenue on a monthly basis. The Index is based on actual revenue statistics from nonprofit organizations of all sizes representing arts, culture, and humanities; education; environment and animals; healthcare; human services; international affairs; medical research; and public and society benefit sectors.
The Blackbaud Index of Online Giving reports that online revenue increased by 10.1% for the 3 months ending April 2013 as compared to the same period in 2012.
Please visit The Blackbaud Index for more information and interactive charts.