Live from NTC! A Sneak Peak at the 2013 Online Benchmark Report

Dennis McCarthy and I had the pleasure of presenting Online Benchmarking: What Worked in 2012 at the Nonprofit Technology Conference in Minneapolis, MN. Though the full report is not out, we shared the key findings to those who attended in person and online.
Blackbaud maintains the Blackbaud Index as well as recently published the Charitable Giving Report and the P2P Benchmark Report to provide nonprofits with the necessary insight to gauge performance, but we’re not alone. NTEN and M&R also released their report, the 2013 eNonprofit Benchmarks Study.
Given the breadth of the data points, you may ask yourself what should I read? Well, we’d hope all of them. A benchmark study is a tool, and like any tool, it depends on how it’s used. The reports alone does not tell us if a program is successful, but identify the trends which are used to inform the health of our online program relative to peers and ensure our approach is on the path toward success.
The 2013 Blackbaud Online Benchmark Report (formerly The Convio Online Benchmark Report) is in its seventh year started by Convio’s Founder, Vinay Bhaghat. The report covers 17 self reported NTEE verticals plus Canada, Teams, and National Non Profits. What’s new this year are email tiers, revenue tiers, and the years your organization has been engaged online. We also require that organizations be on the Luminate platform for three years to minimize distortion.
The key factoids of the 2013 Blackbaud Online Benchmark Report include –
- Approximately 500 non profits and their affiliates
- 16.8 million donations
- 4.2 billion emails sent
- $1.12 billion in revenue
We plan to follow up with additional posts that include analysis (stay tuned!), but the key findings presented at the Nonprofit Technology Conference include:
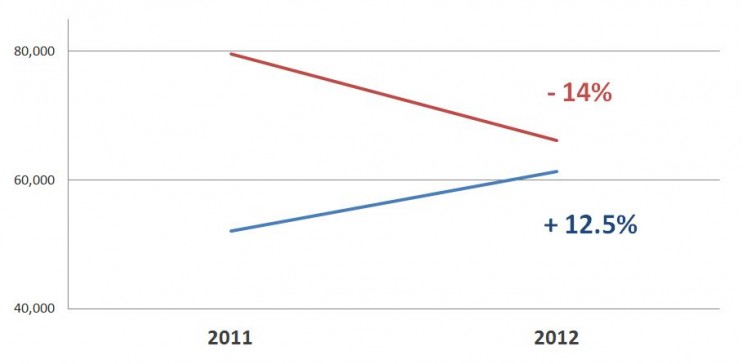
Despite double digit decline in website traffic and minimal change in website conversion rates, email files grew 12.45%.

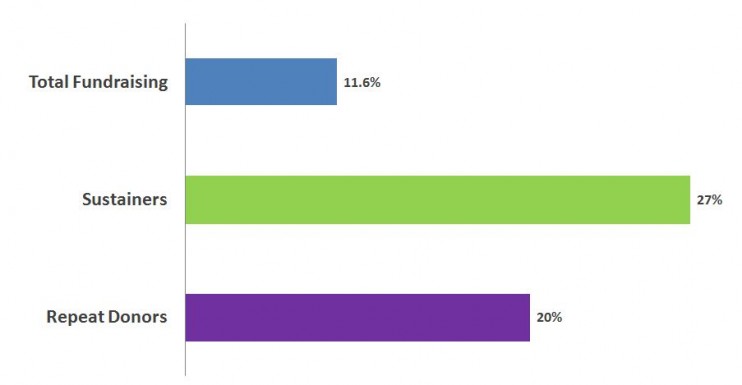
Fundraising continues double digit growth as sustainers and repeat donors grew 27% and 20%, respectively.

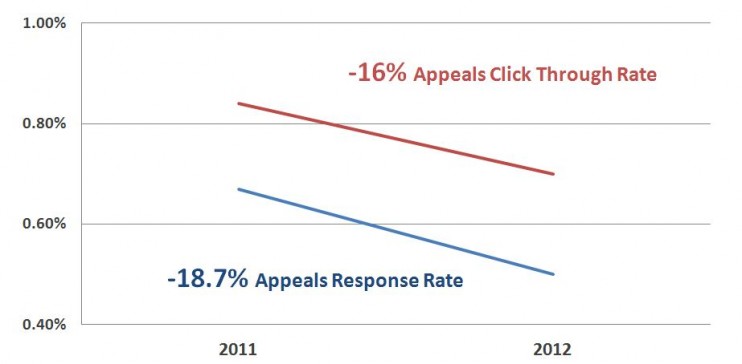
Email opens sees minimal change from previous year, but double digit decline in CTRs. Response rates for appeals also declined 18.7%.

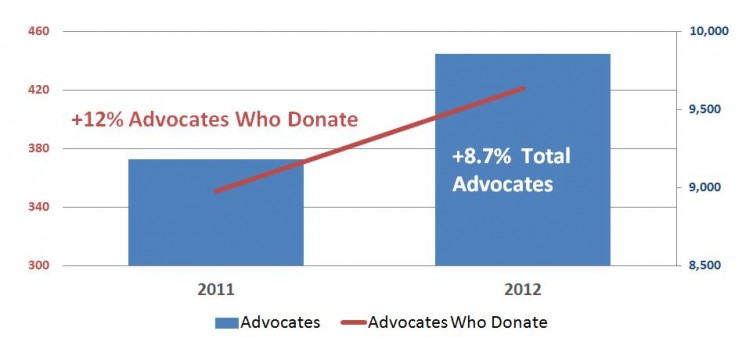
The number of advocates grew, but not at rate of total housefile growth. All verticals saw positive growth in number of advocates who give.

Helpful resources include –
