Don’t Trust Me, Trust Science!
How can you increase your online donations by 20 percent?
I don’t know for sure, but I can show you how to answer that question for yourself using the good ol’ scientific method and Google Analytics. Yes, the same technique that ultimately brought us things like space shuttles and smartphones can help you increase your online donation rates (no beakers or Bunsen burners required).
- Define your key metrics – Do you want to increase form conversion rates, or increase average gift size, increase the number of people signing up for sustaining gifts, or some other factor?
- Gather information and resources – Benchmarks and tips are a great start. See what has worked for other organizations and see if it might apply to you. Check out (https://www.blackbaud.com/nonprofit-resources/onlinemarketingstudy)
- Create your hypothesis (in the form of a new donation page) – You might decide to try a giving catalog or simply add or adjust your online ask string. At this step you will create your alternate donation form experience, but there’s one more step before you make the change live! Just because the new experience looks nice or worked for another organization doesn’t mean it will be successful for you. (Even if you are sure it will be successful, don’t you want to quantify your brilliance to your boss or board?)
- Test the hypothesis by performing an experiment and collecting data – Use Google Analytics Content experiments to test your new idea. You set up both form variations on your site with proper Google Analytics code and Google will automatically route some traffic to the new form and some traffic to the old form, giving you a side by side comparison. Here are Google’s instructions on how to set up content experiments.
- Analyze the data – Once again, Google makes it easy. No need to revisit college statistics, Google will calculate your statistical significance and let you know when the experiment has collected enough data, showing you a summary of how your new form compares to the old form.
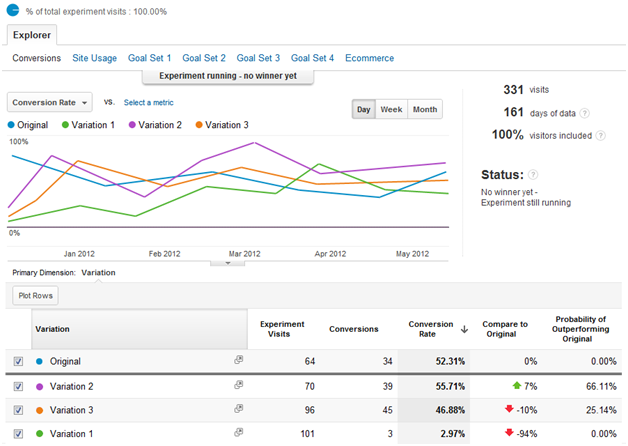
Google Analytics content experiments - Draw conclusions that serve as a starting point for new hypothesis – Did a new technique work well? If so, how can you apply those changes to other donation forms or other areas of your website. What questions come up from your results? Remember, when you think of your new ideas as just hypothesis to test, you’re free to iterate and refine them until you achieve the results you are looking for.
FAQ
The example above doesn’t show donation amount. Can I track this in an experiment?
Yes, you can track donation amount if you have ecommerce tracking set up on Google Analytics.
How much should I change in an experiment?
Its best to change one element, but to make a large change in the element. For example, if you change the layout, add a photo, change your ask string, and remove the confirmation page, then you won’t know what element caused the results that you see. Scientists try to isolate one key variable to study. On the other hand, if you change an ask string by only $5, then the change might not be big enough to cause significant results. So a good rule or thumb is to make a bold change, but only make one type of change at a time. If you have a lot of ideas and enough traffic, you can put up 2-3 new variations. Be careful with more than that, as it might take too long to get enough data on each variation.
What if I make a bad hypothesis?
Remember in school hearing that the only dumb question was the one you don’t ask? It’s better to test than to make assumptions. If one form is seriously under-performing, then Google will show that to visitors less often, to minimize the effect. If you see anything concerning, you can always stop the test. And if you learn that a technique that worked for someone else doesn’t work for you, then that can give you a lot of insight into how your visitors & supporters might be different and what other ideas may work for you.