The Hidden Cost of a Cluttered Chart of Accounts

Every gardener knows that healthy growth requires occasional pruning. Left alone, a thriving tree will keep growing new branches. Some stretch in useful directions. Others drape over your roof, causing unnecessary risk.
A chart of accounts evolves in much the same way.
Over the years, you add new programs, grants, funding sources, and departments. New accounts appear for good reasons. New projects help teams track activity. New segments provide visibility into emerging priorities.
But few organizations have the time to step back and ask which parts of the structure still serve a purpose. As a result, your chart of accounts often becomes a living record of the past. It contains traces of old programs, completed grants, one-time initiatives, and reporting structures that made perfect sense five years ago but no longer reflect how the organization operates today.
Like financial debt, this data debt rarely creates problems at first. Instead, interest accumulates slowly. A report takes a little longer to build. A user selects the wrong account. A reconciliation requires an extra round of review. Someone exports data into a spreadsheet because finding the answer directly in the system feels harder than it should.
Individually, those moments seem minor. But over the course of a fiscal year, they can consume a surprising amount of time and attention.
When Growth Starts Working Against You
Finance teams usually notice the symptoms long before they connect them to the chart of accounts.
Maybe board reporting requires more manual cleanup than it used to. Maybe users constantly ask which account they should select. Maybe finding the right project feels like scrolling through a filing cabinet that contains every piece of paper your organization ever received.
Your chart isn’t broken. It’s simply carrying more history than it needs to. Unused accounts make reporting harder to navigate. Instead of quickly finding relevant data, staff spend time filtering through options that no longer matter. Inactive projects create opportunities for mistakes. When outdated records remain available, users can accidentally post transactions to structures the organization no longer uses.
Audit preparation becomes more complicated, too. Every legacy account and abandoned reporting structure adds context that finance teams need to explain, document, and validate.
The impact extends beyond reporting and compliance. Automation depends on clean, reliable data. The more outdated information lives inside your financial system, the harder it becomes for automated processes and AI-powered tools to produce useful results.
A cluttered chart of accounts creates extra work, and it introduces friction into nearly every financial process that depends on trustworthy data.
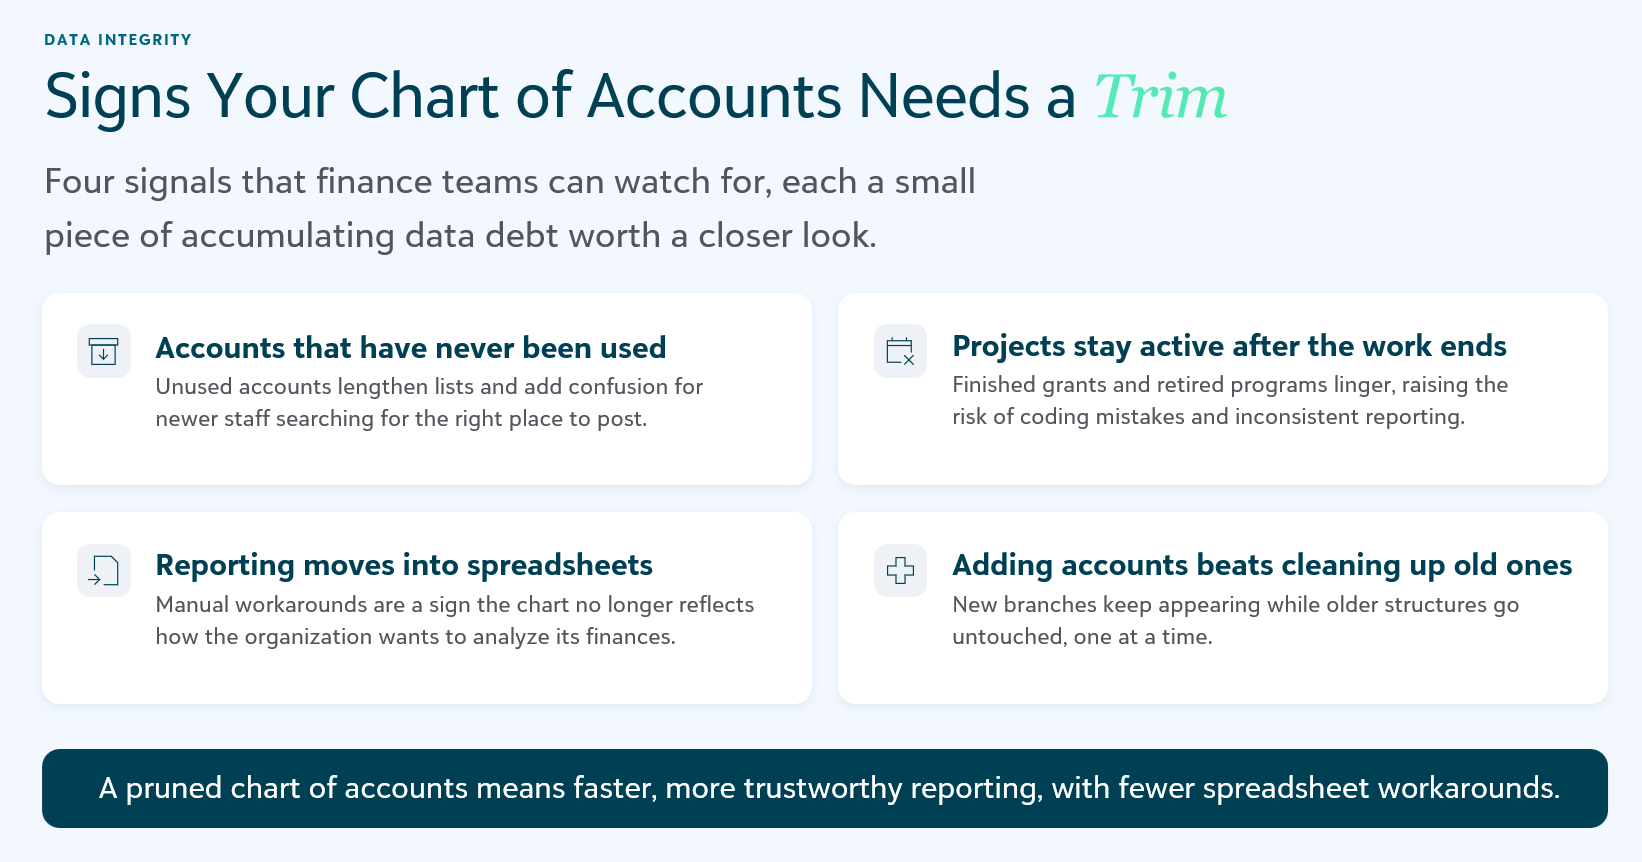
Four Signs It’s Time for a Pruning Session
Chart cleanup competes with budgeting, month-end close, audit preparation, grant management, and board reporting. Every one of those responsibilities comes with deadlines attached. Chart maintenance usually does not.
But just as a gardener looks for signs that a tree needs attention, finance teams can watch for signals that their chart of accounts could benefit from a review.
You have accounts that have never been used
Unused accounts often seem harmless, but they add complexity every time someone searches for the right place to post a transaction. They lengthen lists, create confusion for newer staff members, and make ongoing maintenance more difficult than it needs to be.
Projects remain active long after the work is complete
Finished grants, retired initiatives, and legacy programs can linger in the system for years. Keeping them active means users sort through records that no longer support current operations, which increases the likelihood of coding mistakes and inconsistent reporting.
Reporting regularly leaves the system and moves into spreadsheets
When staff need manual workarounds to answer common financial questions, the chart may no longer reflect the way the organization wants to analyze and manage its finances. The extra spreadsheets may solve the immediate problem, but they rarely remove the underlying complexity.
Adding new accounts feels easier than cleaning up old ones
This may be the clearest sign of accumulating financial data debt. New projects, departments, and funding sources continue to add branches to the tree, while older structures remain untouched. Over time, the chart becomes a record of everything the organization has ever done rather than the work it does today.
None of these issues appear overnight. They develop gradually, which makes them easy to overlook until complexity begins affecting everyday work.
Measuring Chart Health Instead of Guessing
One reason chart cleanup feels overwhelming is that it’s difficult to know where to start.
You might suspect there are inactive accounts somewhere in the system. You may know certain projects haven’t been used recently. What you often lack is a clear picture of the biggest opportunities for improvement.
Rather than requiring teams to manually investigate thousands of records, Chart Health Advisor in Blackbaud Financial Edge NXT® surfaces opportunities to improve chart health. It highlights unused and dormant records, prioritizes issues based on impact, and helps organizations identify where cleanup efforts can deliver the greatest benefit.
When your team can see where complexity has accumulated, maintenance becomes much more manageable. Instead of tackling the entire chart at once, they can focus on the areas most likely to improve usability, reporting efficiency, and data quality.
A good gardener does not prune every branch on the same day. They start with the areas that need attention most. The same principle applies to chart maintenance.
Chart health is one piece of data health
Your chart of accounts often provides the clearest view into data quality issues because the symptoms are easy to spot. But data integrity extends beyond accounts and projects.
Inconsistent data entry practices, duplicate records, spreadsheet-dependent reporting processes, and manual reconciliation work all create friction that affects reporting quality. Organizations preparing for greater automation and AI adoption should think beyond chart cleanup and consider how information flows throughout the business. The same discipline that keeps a chart of accounts healthy can strengthen the data foundation that supports every report, dashboard, and financial decision.
Learn how to identify and address common data integrity challenges in our guide, Data Integrity and Nonprofit Financial Reporting: Steps to Take Now to Best Position Your Organization for Automation and AI.
Build Maintenance Into Governance
You can have a complex chart of accounts that is also well-organized. It just needs regular care.
Organizations grow. Reporting requirements change. New programs emerge. A chart of accounts should evolve alongside those realities. That’s why you need a process for periodic review.
Quarterly chart of accounts reviews, clear governance standards for new accounts, and regular evaluations of inactive records can prevent complexity from accumulating unchecked. Tools like Chart Health Advisor can support that process by helping your team understand where they need to focus before problems begin affecting reporting and decision-making.
A well-maintained chart of accounts creates more confidence. Confidence in reports. Confidence in automation. Confidence that the data supporting strategic decisions reflects how the organization operates today, not how it operated five years ago.
Take the first step toward reducing financial data debt. Whether you’re planning a full chart review or simply curious about where complexity may be building, Chart Health Advisor can help you understand where to start. Check out the article, Strengthening Nonprofit Financial Foundations with Chart Health Advisor, or launch Chart Health Advisor in Financial Edge NXT to explore your chart’s health today.